VTune

Use Intel VTune Profiler to profile serial and multithreaded applications that are executed on a variety of hardware platforms (CPU, GPU, FPGA). The tool is delivered as a Performance Profiler with Intel Performance Snapshots and supports local and remote target analysis on the Windows, Linux, and Android* platforms. Without the right data, you’re guessing about how to improve software performance and are unlikely to make the most effective improvements. Intel® VTune™ Profiler collects key profiling data and presents it with a powerful interface that simplifies its analysis and interpretation.
Environmental models for VTune on ULHPC
module purge
module load swenv/default-env/v1.2-20191021-production
module load toolchain/intel/2019a
module load tools/VTune/2019_update4
module load vis/GTK+/3.24.8-GCCcore-8.2.0
Interactive Mode
# Compilation
$ icc -qopenmp example.c

# Code execution
$ export OMP_NUM_THREADS=16
$ amplxe-cl -collect hotspots -r my_result ./a.out
To see the result in GUI use the command:
amplxe-gui my_result
The command
amplxe-cl
will list out the analysis types and $ amplxe-cl -hlep report will list out available reports in VTune.
Batch Mode
Shared Memory Programming Model (OpenMP)
#!/bin/bash -l
#SBATCH -J VTune
###SBATCH -A <project_name>
#SBATCH -N 1
#SBATCH -c 28
#SBATCH --time=00:10:00
#SBATCH -p batch

module purge
module load swenv/default-env/v1.2-20191021-production
module load toolchain/intel/2019a
module load tools/VTune/2019_update4
module load vis/GTK+/3.24.8-GCCcore-8.2.0

export OMP_NUM_THREADS=16
amplxe-cl -collect hotspots-r my_result ./a.out
Distributed Memory Programming Model
To compile just MPI application run $ mpiicc example.c and for MPI+OpenMP run $ mpiicc -qopenmp example.c.
#!/bin/bash -l
#SBATCH -J VTune
###SBATCH -A <project_name>
#SBATCH -N 2
#SBATCH --ntasks-per-node=28
#SBATCH --time=00:10:00
#SBATCH -p batch
module purge
module load swenv/default-env/v1.2-20191021-production
module load toolchain/intel/2019a
module load tools/VTune/2019_update4
module load vis/GTK+/3.24.8-GCCcore-8.2.0
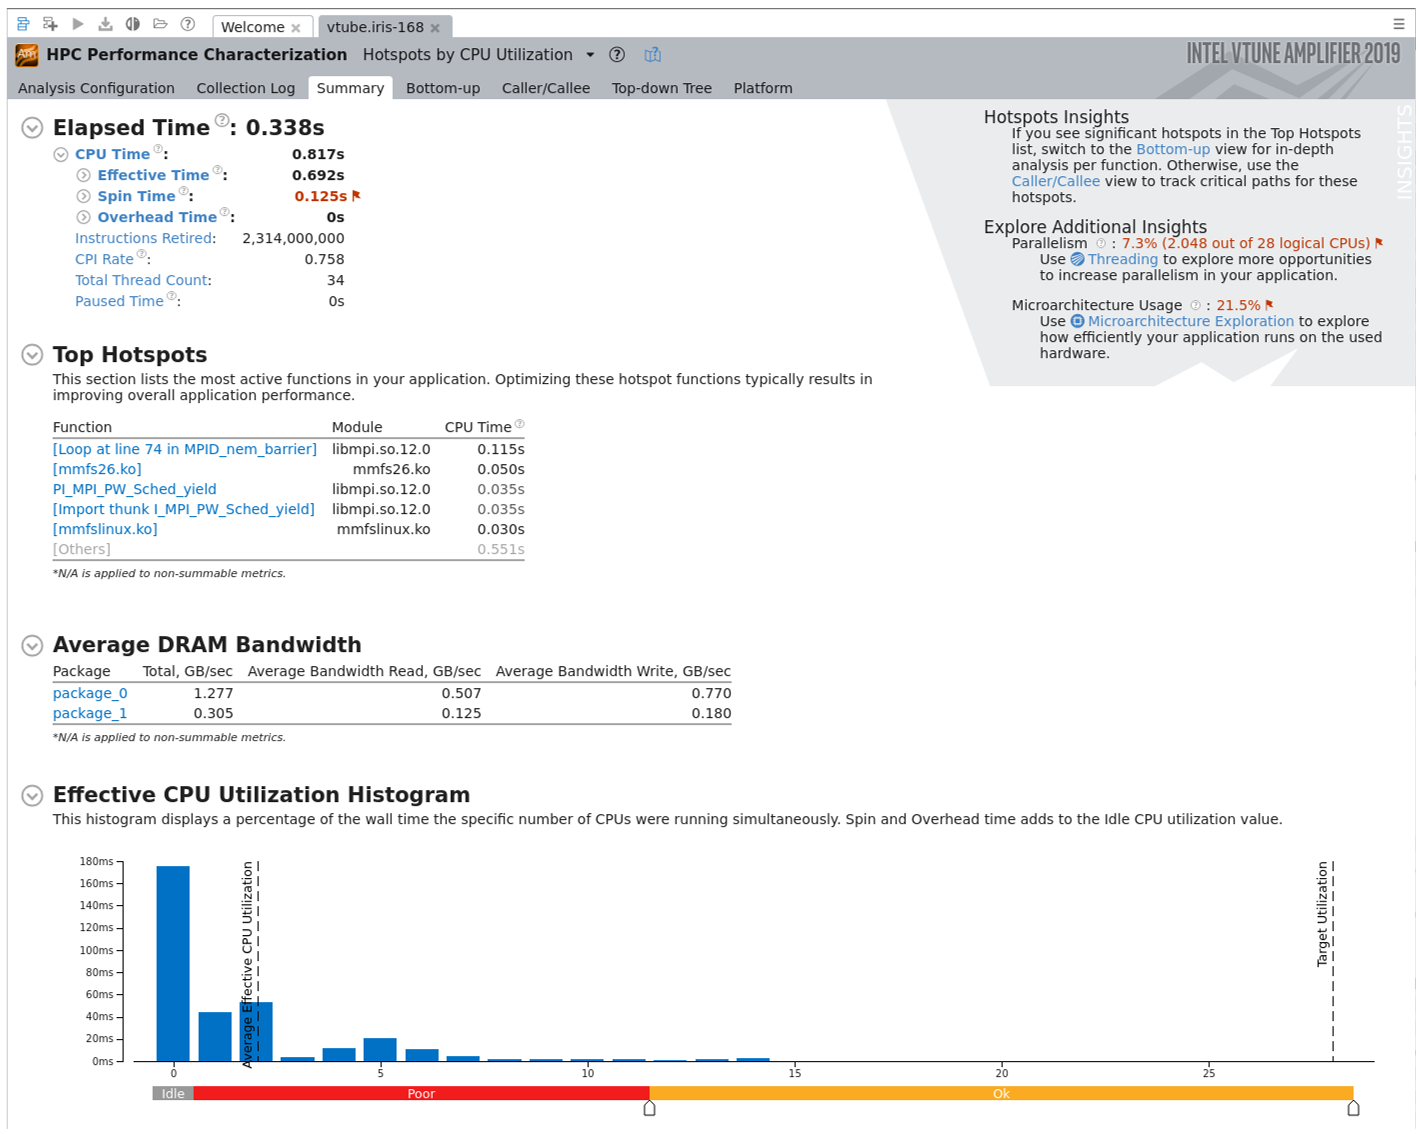
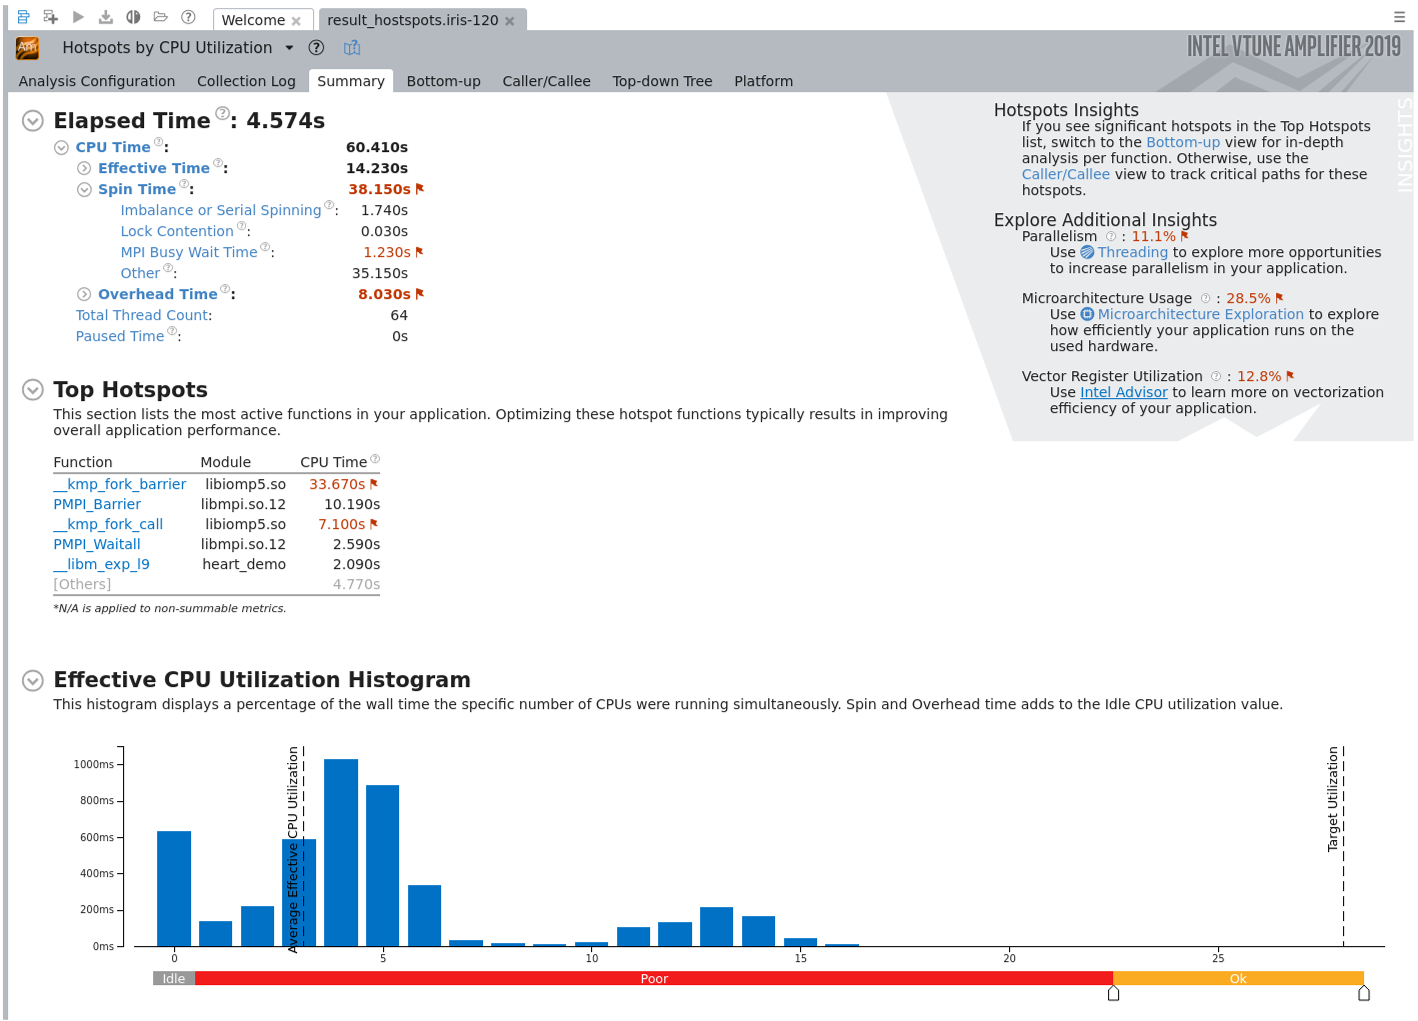
srun -n ${SLURM_NTASKS} amplxe-cl -collect uarch-exploration -r vtune_mpi -- ./a.out
# Report collection
$ amplxe-cl -report uarch-exploration -report-output output -r vtune_mpi

# Result visualization
$ amplxe-gui vtune_mpi
Tip
If you find some issues with the instructions above, please report it to us using support ticket.