Application Performance Snapshot (APS)

Application Performance Snapshot (APS) is a lightweight open source profiling tool developed by the Intel VTune developers. Use Application Performance Snapshot for a quick view into a shared memory or MPI application's use of available hardware (CPU, FPU, and memory). Application Performance Snapshot analyzes your application's time spent in MPI, MPI and OpenMP imbalance, memory access efficiency, FPU usage, and I/O and memory footprint. After analysis, it displays basic performance enhancement opportunities for systems using Intel platforms. Use this tool as a first step in application performance analysis to get a simple snapshot of key optimization areas and learn about profiling tools that specialize in particular aspects of application performance.
Prerequisites
Optional Configuration
Optional: Use the following software to get an advanced metric set when running Application Performance Snapshot:
- Recommended compilers: Intel C/C++ or Fortran Compiler (other compilers can be used, but information about OpenMP imbalance is only available from the Intel OpenMP library).
- Use Intel MPI library version 2017 or later. Other MPICH-based MPI implementations can be used, but information about MPI imbalance is only available from the Intel MPI library. There is no support for OpenMPI.
Optional: Enable system-wide monitoring to reduce collection overhead and collect memory bandwidth measurements. Use one of these options to enable system-wide monitoring:
- Set the
/proc/sys/kernel/perf_event_paranoidvalue to 0 (or less), or - Install the Intel VTune Amplifier drivers. Driver sources are available in
<APS_install_dir>/internal/sepdk/src. Installation instructions are available in the online documentation.
Before running the tool, set up your environment appropriately:
module purge
module load swenv/default-env/v1.2-20191021-production
module load tools/VTune/2019_update4
module load toolchain/intel/2019a
Analyzing Shared Memory Applications
Run the following commands (interactive mode):
# Compilation
$ icc -qopenmp example.c

# Code execution
aps --collection-mode=all -r report_output ./a.out
aps -help will list out --collection-mode=<mode> available in APS.
# To create a .html file
aps-report -g report_output

# To open an APS results in the browser
firefox report_output_<postfix>.html
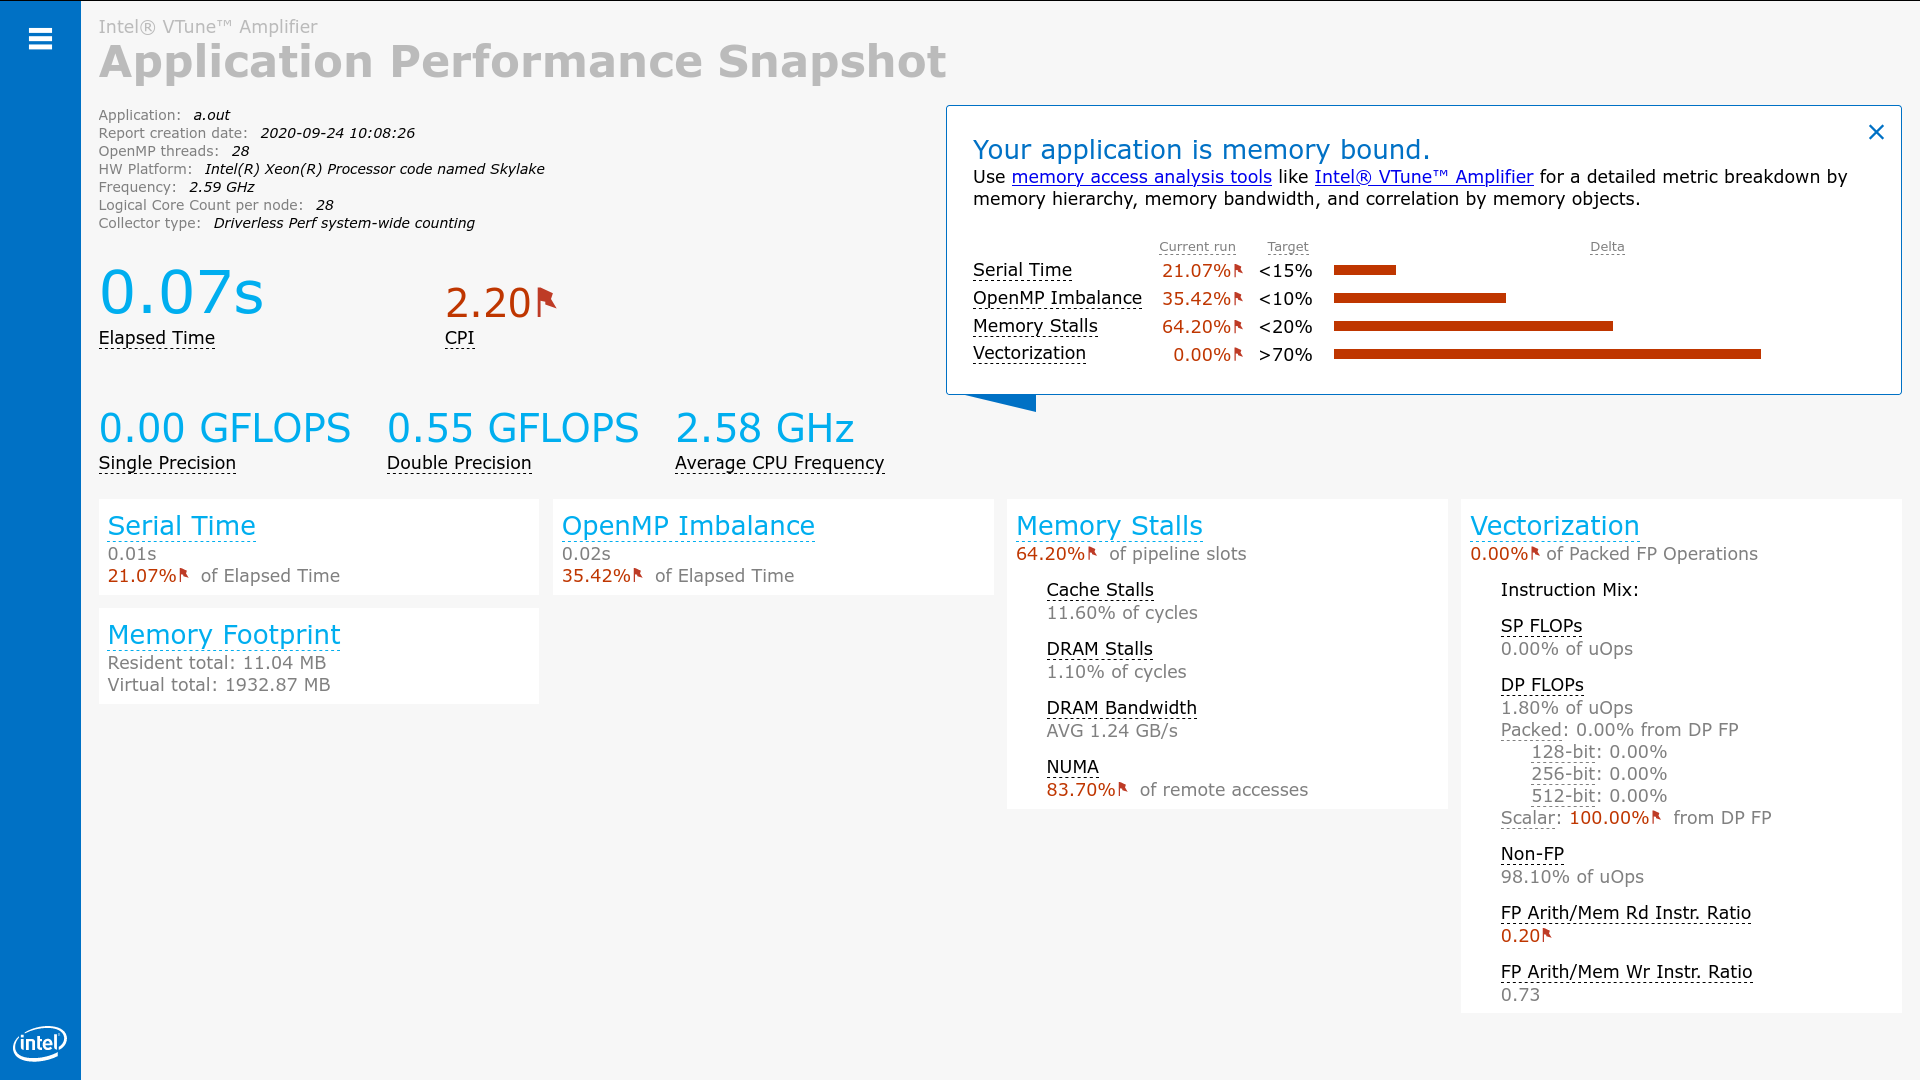
The below figure shows the example of result can be seen in the browser:
# To see the command line output
$ aps-report <result_dir>
Example for the batch script:
#!/bin/bash -l
#SBATCH -J APS
#SBATCH -N 1
###SBATCH -A <project_name>
#SBATCH -c 28
#SBATCH --time=00:10:00
#SBATCH -p batch
#SBATCH --nodelist=node0xx

module purge
module load swenv/default-env/v1.2-20191021-production
module load tools/VTune/2019_update4
module load toolchain/intel/2019a

export OMP_NUM_THREADS=16
aps --collection-mode=all -r report_output ./a.out
Analyzing MPI Applications
To compile just MPI application run $ mpiicc example.c and for MPI+OpenMP run $ mpiicc -qopenmp example.c. Example for the batch script:
#!/bin/bash -l
#SBATCH -J APS
#SBATCH -N 2
###SBATCH -A <project_name>
#SBATCH --ntasks-per-node=14
#SBATCH -c 2
#SBATCH --time=00:10:00
#SBATCH -p batch
#SBATCH --reservation=<name>

module purge
module load swenv/default-env/v1.2-20191021-production
module load tools/VTune/2019_update4
module load toolchain/intel/2019a

# To collect all the results
export MPS_STAT_LEVEL=${SLURM_CPUS_PER_TASK:-1}
# An option for the OpenMP+MPI application
export OMP_NUM_THREADS=${SLURM_CPUS_PER_TASK:-1}
srun -n ${SLURM_NTASKS} aps --collection-mode=mpi -r result_output ./a.out
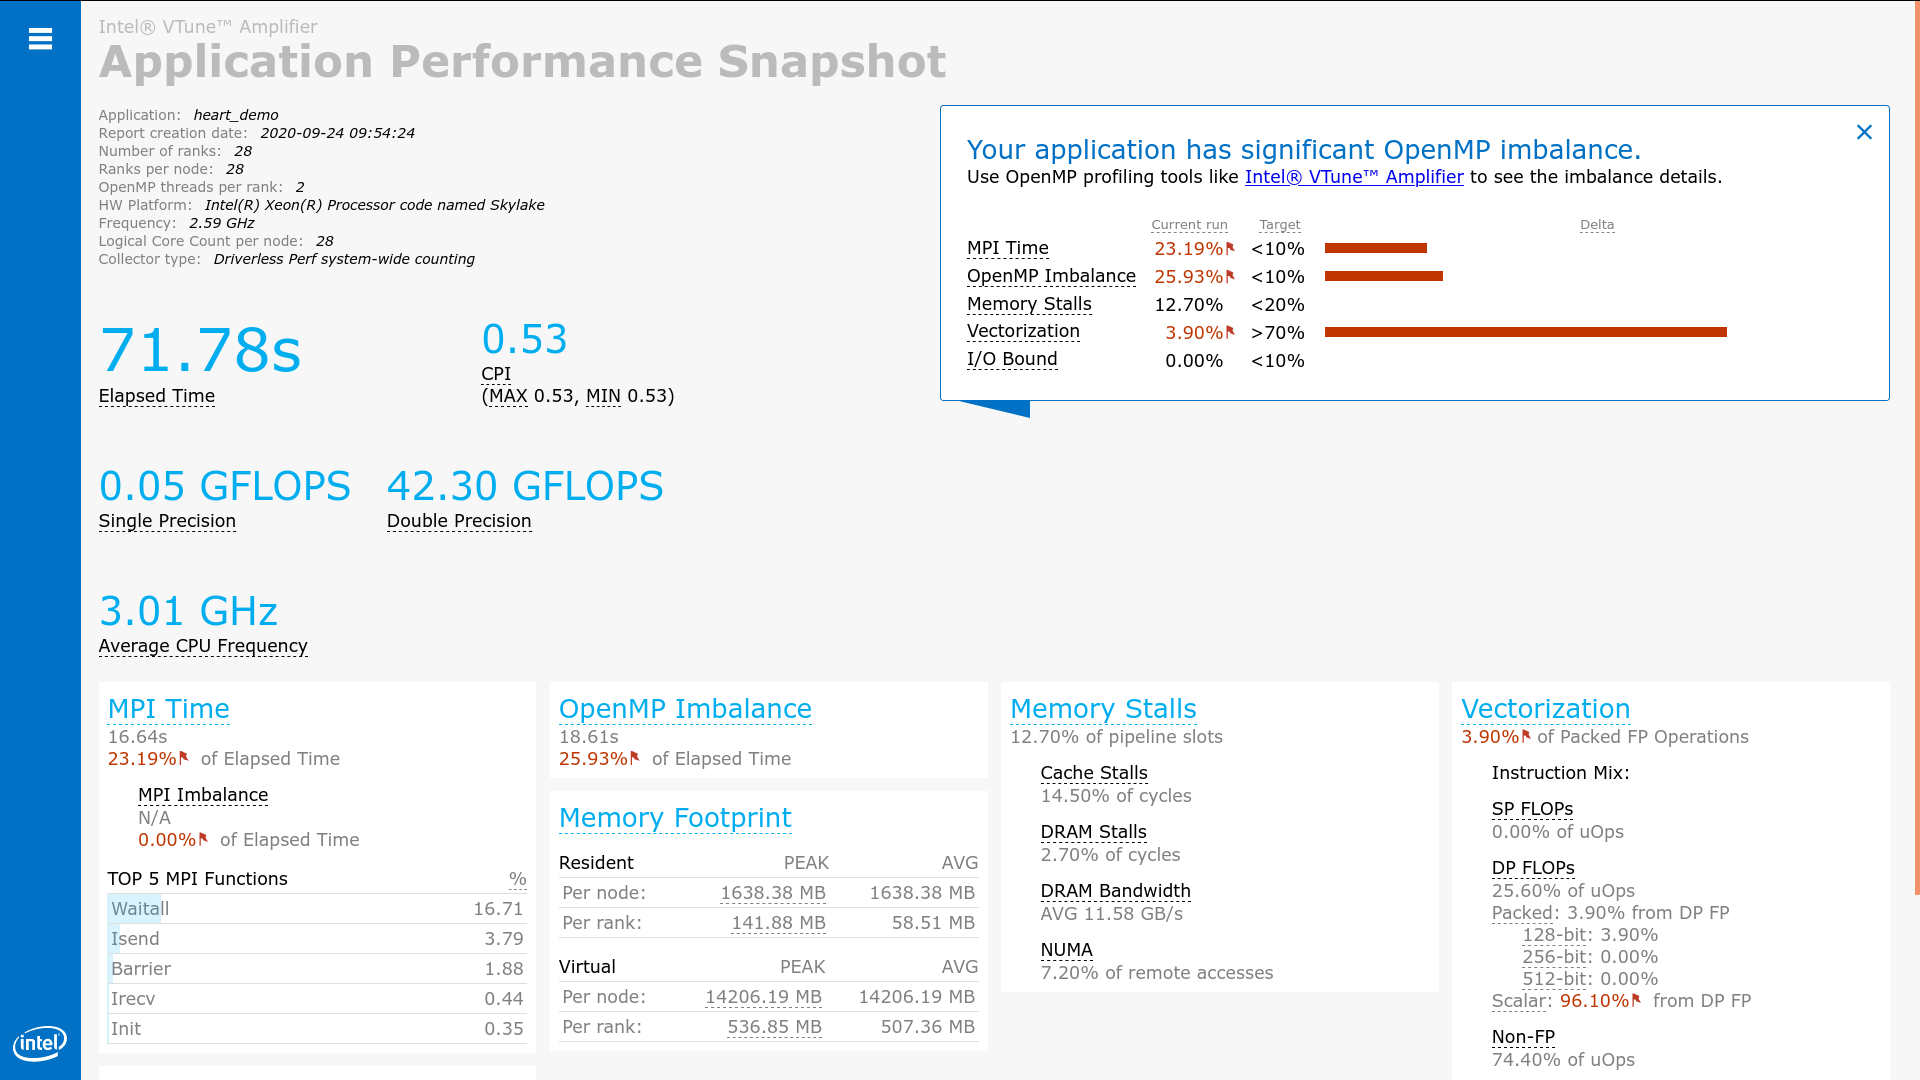
The below figure shows the hybrid(MPI+OpenMP) programming analysis results:
Next Steps
- Intel Trace Analyzer and Collector is a graphical tool for understanding MPI application behavior, quickly identifying bottlenecks, improving correctness, and achieving high performance for parallel cluster applications running on Intel architecture. Improve weak and strong scaling for applications. Get started.
- Intel VTune Amplifier provides a deep insight into node-level performance including algorithmic hotspot analysis, OpenMP threading, general exploration microarchitecture analysis, memory access efficiency, and more. It supports C/C++, Fortran, Java, Python, and profiling in containers. Get started.
- Intel Advisor provides two tools to help ensure your Fortran, C, and C++ applications realize full performance potential on modern processors. Get started.
- Vectorization Advisor is an optimization tool to identify loops that will benefit most from vectorization, analyze what is blocking effective vectorization, and forecast the benefit of alternative data reorganizations.
- Threading Advisor is a threading design and prototyping tool to analyze, design, tune, and check threading design options without disrupting a regular environment.
Quick Metrics Reference
The following metrics are collected with Application Performance Snapshot. Additional detail about each of these metrics is available in the Intel VTune Amplifier online help.
Elapsed Time: Execution time of specified application in seconds.
SP GFLOPS: Number of single precision giga-floating point operations calculated per second. All double operations are converted to two single operations. SP GFLOPS metrics are only available for 3rd Generation Intel Core processors, 5th Generation Intel processors, and 6th Generation Intel processors.
Cycles per Instruction Retired (CPI): The amount of time each executed instruction took measured by cycles. A CPI of 1 is considered acceptable for high performance computing (HPC) applications, but different application domains will have varied expected values. The CPI value tends to be greater when there is long-latency memory, floating-point, or SIMD operations, non-retired instructions due to branch mispredictions, or instruction starvation at the front end.
MPI Time: Average time per process spent in MPI calls. This metric does not include the time spent in MPI_Finalize. High values could be caused by high wait times inside the library, active communications, or sub-optimal settings of the MPI library. The metric is available for MPICH-based MPIs.
MPI Imbalance: CPU time spent by ranks spinning in waits on communication operations. A high value can be caused by application workload imbalance between ranks, or non-optimal communication schema or MPI library settings. This metric is available only for Intel MPI Library version 2017 and later.
OpenMP Imbalance: Percentage of elapsed time that your application wastes at OpenMP synchronization barriers because of load imbalance. This metric is only available for the Intel OpenMP Runtime Library.
CPU Utilization: Estimate of the utilization of all logical CPU cores on the system by your application. Use this metric to help evaluate the parallel efficiency of your application. A utilization of 100% means that your application keeps all of the logical CPU cores busy for the entire time that it runs. Note that the metric does not distinguish between useful application work and the time that is spent in parallel runtimes.
Memory Stalls: Indicates how memory subsystem issues affect application performance. This metric measures a fraction of slots where pipeline could be stalled due to demand load or store instructions. If the metric value is high, review the Cache and DRAM Stalls and the percent of remote accesses metrics to understand the nature of memory-related performance bottlenecks. If the average memory bandwidth numbers are close to the system bandwidth limit, optimization techniques for memory bound applications may be required to avoid memory stalls.
FPU Utilization: The effective FPU usage while the application was running. Use the FPU Utilization value to evaluate the vector efficiency of your application. The value is calculated by estimating the percentage of operations that are performed by the FPU. A value of 100% means that the FPU is fully loaded. Any value over 50% requires additional analysis. FPU metrics are only available for 3rd Generation Intel Core processors, 5th Generation Intel processors, and 6th Generation Intel processors.
I/O Operations: The time spent by the application while reading data from the disk or writing data to the disk. Read and Write values denote mean and maximum amounts of data read and written during the elapsed time. This metric is only available for MPI applications.
Memory Footprint: Average per-rank and per-node consumption of both virtual and resident memory.
Documentation and Resources
- Intel Performance Snapshot User Forum: User forum dedicated to all Intel Performance Snapshot tools, including Application Performance Snapshot
- Application Performance Snapshot: Application Performance Snapshot product page, see this page for support and online documentation
- Application Performance Snapshot User's Guide: Learn more about Application Performance Snapshot, including details on specific metrics and best practices for application optimization
Tip
If you find some issues with the instructions above, please report it to us using support ticket.